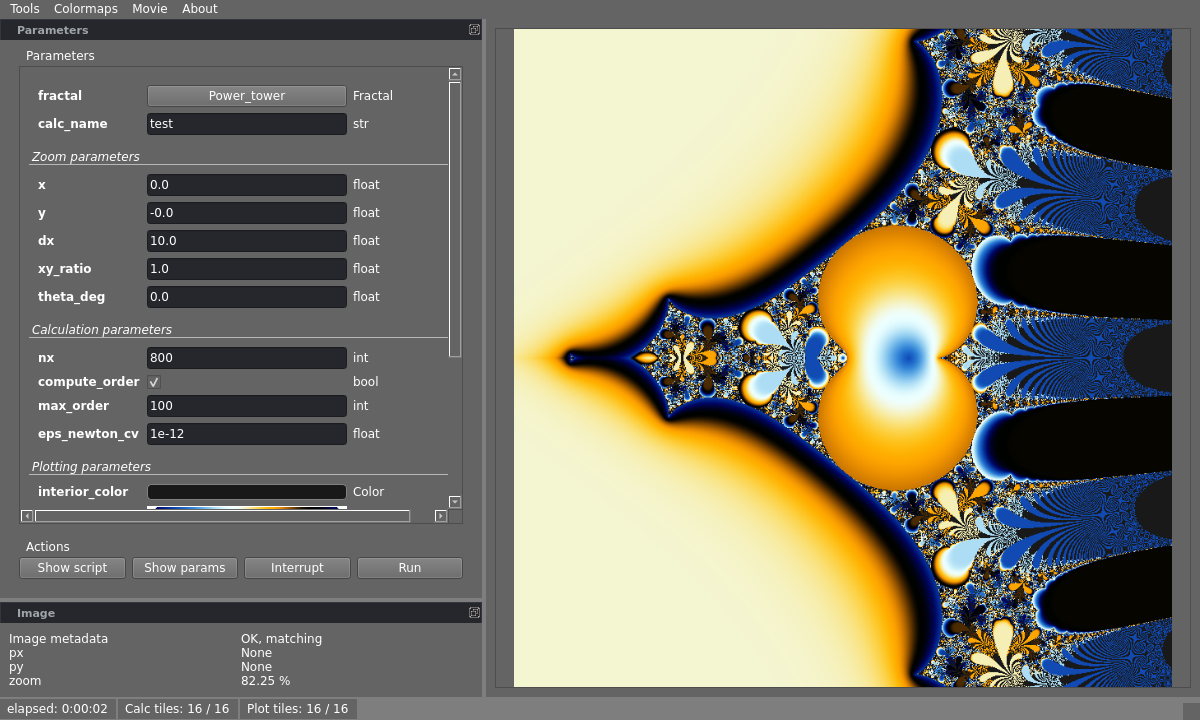
Note
Go to the end to download the full example code
S05 - Tetration fractal explorer - Standard precision
A template to explore the tetration fractal set (aka power-tower) with the GUI (example of “low-level API” for GUI implementation). Resolution limited to approx 1.e-13 due to double (float64) precision.
Coloring is based on the limit cycle order and attractivity. The influence of
attractivity can be tuned with the attr_strength parameter
Reference:
fractalshades.models.Power_tower

import typing
import os

import numpy as np

import fractalshades as fs
import fractalshades.models as fsm
import fractalshades.settings as settings
import fractalshades.colors
import fractalshades.gui
from fractalshades.gui.guimodel import Fractal_GUI

from fractalshades.postproc import (
    Postproc_batch,
    Raw_pp,
)
from fractalshades.colors.layers import (
    Color_layer,
    Bool_layer,
    Virtual_layer,
)


def plot(plot_dir):
    """
    Example interactive
    """
    calc_name = 'test'

    x = 0.0
    y = -0.0
    dx = 10.0
    xy_ratio = 1.0
    theta_deg=0.

    compute_order = True
    max_order = 100
    nx = 800
    eps_newton_cv = 1e-12

    colormap = fs.colors.cmap_register["classic"]

    zmin = 0.00
    zmax = 0.25
    attr_strength = 0.15

    # Set to True to enable multi-processing
    settings.enable_multiprocessing = True
    # Set to True in case RAM issue (Memory error)
    settings.optimize_RAM = False

    directory = plot_dir
    fractal = fsm.Power_tower(directory)

    def func(
        fractal: fsm.Mandelbrot=fractal,
         calc_name: str= calc_name,
         _1: fs.gui.separator="Zoom parameters",
         x: float= x,
         y: float= y,
         dx: float= dx,
         xy_ratio: float=xy_ratio,
         theta_deg: float=theta_deg,
         _2: fs.gui.separator="Calculation parameters",
         nx: int=nx,
         compute_order: bool=compute_order,
         max_order: int=max_order,
         eps_newton_cv: float=eps_newton_cv,
         _3: fs.gui.separator="Plotting parameters",
         interior_color: fs.colors.Color=(0.1, 0.1, 0.1),
         colormap: fs.colors.Fractal_colormap=colormap,
         cmap_z_kind: typing.Literal["relative", "absolute"]="relative",
         zmin: float=zmin,
         zmax: float=zmax,
         zshift: float=0.0,
         attr_strength: float =attr_strength,
         _4: fs.gui.collapsible_separator="High-quality rendering options",
         final_render: bool=False,
         supersampling: fs.core.supersampling_type = "None",
         jitter: bool = False,
         recovery_mode: bool = False,

    ):

        fractal.zoom(x=x, y=y, dx=dx, nx=nx, xy_ratio=xy_ratio,
             theta_deg=theta_deg, projection="cartesian")

        fractal.newton_calc(
            calc_name=calc_name,
            subset=None,
            compute_order=compute_order,
            max_order=max_order,
            max_newton=20,
            eps_newton_cv=eps_newton_cv
        )


        layer_name = "cycle_order"

        pp = Postproc_batch(fractal, calc_name)
        pp.add_postproc(layer_name, Raw_pp("order"))
        pp.add_postproc("attr", Raw_pp("dzrdz", func=lambda x: np.abs(x)))
        pp.add_postproc("interior", Raw_pp("stop_reason",
                        func=lambda x: x != 1)
        )

        plotter = fs.Fractal_plotter(
            pp,
            final_render=final_render,
            supersampling=supersampling,
            jitter=jitter,
            recovery_mode=recovery_mode
        )
        plotter.add_layer(Bool_layer("interior", output=False))
        plotter.add_layer(Color_layer(
                layer_name,
                func=lambda x: np.log(np.log(x + 1.) + 1.),
                colormap=colormap,
                probes_z=[zmin + zshift, zmax + zshift],
                output=True))
        plotter[layer_name].set_mask(plotter["interior"],
                                     mask_color=interior_color)
        plotter.add_layer(Virtual_layer("attr", func=None, output=False))

        plotter[layer_name].set_twin_field(plotter["attr"], attr_strength)

        plotter.plot()

        # Renaming output to match expected from the Fractal GUI
        layer = plotter[layer_name]
        file_name = "{}_{}".format(type(layer).__name__, layer.postname)
        src_path = os.path.join(fractal.directory, file_name + ".png")
        dest_path = os.path.join(fractal.directory, calc_name + ".png")
        if os.path.isfile(dest_path):
            os.unlink(dest_path)
        os.link(src_path, dest_path)


    gui = Fractal_GUI(func)
    gui.connect_image(image_param="calc_name")
    gui.connect_mouse(dps=None)
    gui.show()


if __name__ == "__main__":
    # Some magic to get the directory for plotting: with a name that matches
    # the file or a temporary dir if we are building the documentation
    try:
        realpath = os.path.realpath(__file__)
        plot_dir = os.path.splitext(realpath)[0]
        plot(plot_dir)
    except NameError:
        import tempfile
        with tempfile.TemporaryDirectory() as plot_dir:
            fs.utils.exec_no_output(plot, plot_dir)
Total running time of the script: ( 0 minutes 4.977 seconds)