Note
Go to the end to download the full example code
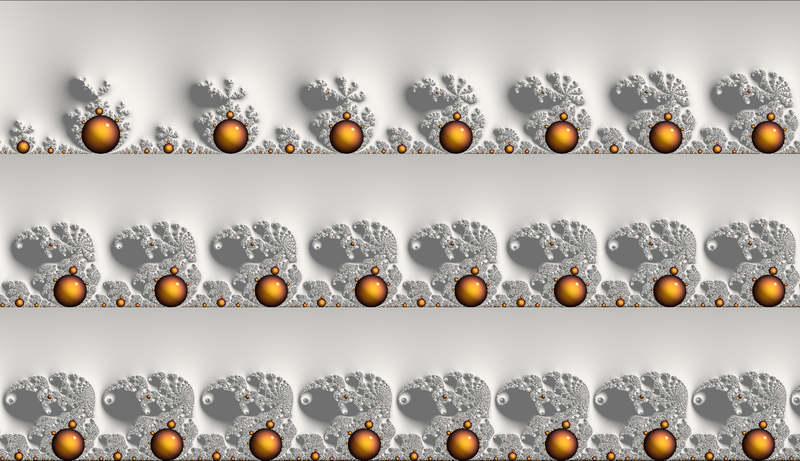
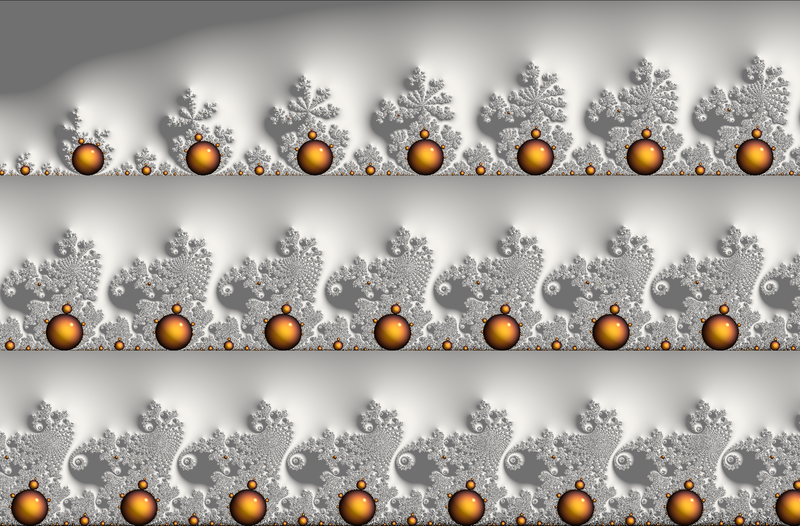
P03 - Moebius mapping: Elephant and Seahorse valleys
This example demonstrates a more complex use of the class Generic_mapping.
Three transformations are defined and chained to unwrap an blow-out an area of Mandelbrot set main cardioid: either the Elephant valley - starting at (+0.25, 0.) - or the Seahorse valley - starting at (-0.75, 0.).
The main idea is as follow:
A first mapping
f1transforms the cardioid to a unit circleA second mapping
f2use a Moebius transform to unwrap and blow-out the area of interest - so that each bulb is scaled to similar sizeThis results in a very long frieze, so a third mapping
f3is used present the result on several stages like a photo-board.
Note
A Moebius transformation is a rational map of the complex plane of the form:
it maps generalized circles to generalized circles (generalized circles include lines as a special case).
The main idea here is choose 3 points on the base image (P0, P1, Pinf) which define a circle, and map them respectively to 0., 1., inf.
Reference:
fractalshades.projection.Generic_mapping
Credit: Based on an original idea from: https://mathr.co.uk/blog/2013-12-16_stretching_cusps.html
import os
import typing

import numpy as np
import mpmath
from PyQt6 import QtGui
import numba

import fractalshades
import fractalshades as fs
import fractalshades.models as fsm
import fractalshades.gui as fsgui
import fractalshades.colors as fscolors
import fractalshades.projection

from fractalshades.postproc import (
    Postproc_batch,
    Continuous_iter_pp,
    DEM_normal_pp,
    Fieldlines_pp,
    DEM_pp,
    Raw_pp,
    Attr_pp,
    Attr_normal_pp,
    Fractal_array
)
from fractalshades.colors.layers import (
    Color_layer,
    Bool_layer,
    Normal_map_layer,
    Grey_layer,
    Disp_layer,
    Virtual_layer,
    Blinn_lighting,
    Overlay_mode
)

# Chose one of "Seahorse", "Elephant" (or both):
valleys = ("Elephant", "Seahorse")


def setargs_Elephant(plot_kwargs):
    """
    This function defines the projection and adapts the zoom kwargs for the
    plotting of Elephant valley

    returns: plot_kwargs, batch_params
    """

    width = 7.8   # float, width of the frieze
    levels = 3    # int, number of levels for the 'photo-board'

    # The '1 level' frieze
    left_tot = 0.25 #- (2 - 0.25) * 1j
    right_tot = 0.25 + width #- (2 - 0.25) * 1j + n
    low_tot = -1.75 - 0.25
    high_tot = -1.75 + 0.25

    # The 'n level' image
    left = left_tot
    right = left_tot + width / levels
    low = high_tot - (high_tot - low_tot) * levels
    high =  high_tot

    z_center =  (left + right) * 0.5 + (low + high) * 0.5j
    dx =  (right - left)
    xy_ratio = (right - left) / (high - low)

    @numba.njit
    def f1(z):
        # map the cardioid to a unit circle
        return (1 - (z + 1.) ** 2) / 4.

    @numba.njit
    def df1(z):
        return -(z + 1.) / 2.

    P0 = 1.
    P1 = 1j
    Pinf = -1.

    a, b, c, d = (
        (P1 - Pinf), -P0 * (P1 - Pinf), (P1 - P0), -Pinf * (P1 - P0)
    )
    a_inv, b_inv, c_inv, d_inv = d, -b, -c, a

    @numba.njit
    def f2(z):
        # Moebius map with P0 -> 0, P1 -> 1, Pinf ->inf
        return (a_inv * z + b_inv) / (c_inv * z + d_inv)

    @numba.njit
    def df2(z):
        det = a_inv * d_inv - b_inv * c_inv
        return det / (c_inv * z + d_inv) ** 2

    @numba.njit
    def f3(z):
        # wrapping several levels
        level, yfrac = divmod(z.imag - high_tot, high_tot - low_tot)
        y = yfrac  + low_tot
        x = z.real  + (-1 - level) * (right - left)
        return complex(x, y)

    @numba.njit
    def df3(z):
        return 1.

    projection = fs.projection.Generic_mapping((f3, f2, f1), (df3, df2, df1))

    plot_kwargs["x"] = z_center.real
    plot_kwargs["y"] = z_center.imag
    plot_kwargs["dx"] = dx
    plot_kwargs["xy_ratio"] = xy_ratio

    batch_params = {
        "projection": projection
    }

    return plot_kwargs, batch_params


def setargs_Seahorse(kwargs):
    """
    This function defines the projection and adapts the zoom kwargs for the
    plotting of Seahorse valley

    returns: plot_kwargs, batch_params
    """
    width = 8.2
    levels = 3

    # The '1 level' frieze
    left_tot = 0.5 #- (2 - 0.25) * 1j
    right_tot = 0.5 + width #- (2 - 0.25) * 1j + n
    low_tot = -3.9
    high_tot = -2.0

    low_tot = 0
    high_tot = 0.6

    # The 'n level' image
    left = left_tot
    right = left_tot + width / levels
    low = high_tot - (high_tot - low_tot) * levels
    high =  high_tot

    z_center =  (left + right) * 0.5 + (low + high) * 0.5j
    dx =  (right - left)
    xy_ratio = (right - left) / (high - low)

    @numba.njit
    def f1(z):
        # map the cardioid to a unit circle
        return (1 - (z + 1.) ** 2) / 4.

    @numba.njit
    def df1(z):
        return -(z + 1.) / 2.

    P0 = -1j
    P1 = (1. + 1j) / np.sqrt(2.)
    Pinf = 1.

    a, b, c, d = (
        (P1 - Pinf), -P0 * (P1 - Pinf), (P1 - P0), -Pinf * (P1 - P0)
    )
    a_inv, b_inv, c_inv, d_inv = d, -b, -c, a

    @numba.njit
    def f2(z):
        # Moebius map with P0 -> 0, P1 -> 1, Pinf ->inf
        return (a_inv * z + b_inv) / (c_inv * z + d_inv)

    @numba.njit
    def df2(z):
        det = a_inv * d_inv - b_inv * c_inv
        return det / (c_inv * z + d_inv) ** 2

    @numba.njit
    def f3(z):
        # wrapping several levels
        level, yfrac = divmod(z.imag - high_tot, high_tot - low_tot)
        y = yfrac  + low_tot
        x = z.real  + (-1 - level) * (right - left)
        return complex(x, y)

    @numba.njit
    def df3(z):
        return 1.

    projection = fs.projection.Generic_mapping((f3, f2, f1), (df3, df2, df1))

    plot_kwargs["x"] = z_center.real
    plot_kwargs["y"] = z_center.imag
    plot_kwargs["dx"] = dx
    plot_kwargs["xy_ratio"] = xy_ratio

    batch_params = {
        "projection": projection
    }

    return plot_kwargs, batch_params


#------------------------------------------------------------------------------
# Parameters - user editable
#------------------------------------------------------------------------------
plot_kwargs = {
    "fractal": None,
    "calc_name": "std_zooming_calc",
    "_1": "Zoom parameters",
    "x": 0.,
    "y": 0.,
    "dx": 1.,
    "xy_ratio": 1.,
    "theta_deg": 0.0,
    "nx": 2400,
    "_2": "Calculation parameters",
    "max_iter": 5000,
    "M_divergence": 1000.0,
    "epsilon_stationnary": 0.01,
    "_3": "Newton parameters",
    "compute_newton": True,
    "max_order": 30000,
    "max_newton": 20,
    "eps_newton_cv": 1e-08,
    "_4": "Plotting parameters: base field",
    "base_layer": "continuous_iter",
    "colormap": fs.colors.Fractal_colormap(
        colors=[[0.67450982, 0.67450982, 0.67450982],
             [0.67450982, 0.67450982, 0.67450982]],
        kinds=['Lch'],
        grad_npts=[3],
        grad_funcs=['x'],
        extent='repeat'
),
    "cmap_func": fractalshades.numpy_utils.expr_parser.Numpy_expr(
        variables=[
            "x",
        ],
        expr="np.log(x)",
    ),
    "zmin": 0.0,
    "zmax": 5.0,
    "zshift": -1.0,
    "mask_color": (
        0.1,
        0.1,
        0.1,
        1.0,
    ),
    "_7": "Plotting parameters: Newton field",
    "int_layer": "attractivity",
    "colormap_int": fs.colors.Fractal_colormap(
        colors=[[0.        , 0.        , 0.        ],
                [0.9688    , 0.7176    , 0.2488    ]],
        kinds=['Lch'],
        grad_npts=[8],
        grad_funcs=['x**2'],
        extent='mirror'
),
    "cmap_func_int": fractalshades.numpy_utils.expr_parser.Numpy_expr(
        variables=[
            "x",
        ],
        expr="x",
    ),
    "zmin_int": 0.0,
    "zmax_int": 1.0,
    "_5": "Plotting parameters: shading",
    "has_shading": True,
    "shading_kind": "potential",
    "lighting": fs.colors.layers.Blinn_lighting(
        k_ambient=0.4,
        color_ambient=[1., 1., 1.],
        ls0={
            'k_diffuse': 1.8,
            'k_specular': 15.0,
            'shininess': 500.0,
            'polar_angle': 50.0,
            'azimuth_angle': 20.0,
            'color': [1.  , 1.  , 0.95],
            'material_specular_color': None
        },
    ),
    "lighting_int": fs.colors.layers.Blinn_lighting(
        k_ambient=0.4,
        color_ambient=[1.        , 1.        , 0.49803922],
        ls0={
            'k_diffuse': 1.8,
            'k_specular': 15.0,
            'shininess': 500.0,
            'polar_angle': 50.0,
            'azimuth_angle': 20.0,
            'color': [1.  , 1.  , 0.95],
            'material_specular_color': None
        },
    ),
    "max_slope": 60.0,
    "_6": "Plotting parameters: field lines",
    "has_fieldlines": False,
    "fieldlines_func": fractalshades.numpy_utils.expr_parser.Numpy_expr(
        variables=[
            "x",
        ],
        expr="x",
    ),
    "fieldlines_kind": "overlay",
    "fieldlines_zmin": -1.0,
    "fieldlines_zmax": 1.0,
    "backshift": 3,
    "n_iter": 4,
    "swirl": 0.0,
    "damping_ratio": 0.8,
    "twin_intensity": 0.1,

    "_8": "High-quality rendering options",
    "final_render": False,
    "supersampling": "3x3",
    "jitter": False,
    "recovery_mode": False,

    "_9": "Extra outputs",
    "output_masks": False,
    "output_normals": False,
    "output_heightmaps": False,
    "hmap_mask": 0.0,
    "int_hmap_mask": 0.0,

    "_10": "General settings",
    "log_verbosity": "debug @ console + log",
    "enable_multithreading": True,
    "inspect_calc": False,
    "no_newton": False,
    "postproc_dtype": "float32",

    "_1b": None,
    "has_skew": False,
    "skew_00": 1.0,
    "skew_01": 0.0,
    "skew_10": 0.0,
    "skew_11": 1.0,
    "calc_dzndc": False,
    "interior_detect": True,
    "dps": None,
}


#------------------------------------------------------------------------------
# Function - /!\ do not modify this section
#------------------------------------------------------------------------------
def plot(
    fractal: fs.Fractal=None,
    calc_name: str="std_zooming_calc",

    _1: fs.gui.collapsible_separator="Zoom parameters",
    x: float = 0.0,
    y: float = 0.0,
    dx: float = 10.0,
    dps: int = None,
    xy_ratio: float = 1.0,
    theta_deg: float = 0.0,
    nx: int = 600,

    _1b: fs.gui.collapsible_separator = None,
    has_skew: bool = False,
    skew_00: float = 1.0,
    skew_01: float = 0.0,
    skew_10: float = 0.0,
    skew_11: float = 1.0,

    _2: fs.gui.collapsible_separator="Calculation parameters",
    max_iter: int = 5000,
    M_divergence: float = 1000.,
    interior_detect: bool = True,
    epsilon_stationnary: float = 0.001,
    calc_dzndc: bool = False,

    _3: fs.gui.collapsible_separator = "Newton parameters",
    compute_newton: bool = True,
    max_order: int = 1500,
    max_newton: int = 20,
    eps_newton_cv: float =1.e-8,

    _4: fs.gui.collapsible_separator="Plotting parameters: base field",
    base_layer: typing.Literal[
             "continuous_iter",
             "distance_estimation"
    ]="continuous_iter",

    colormap: fs.colors.Fractal_colormap=(
            fs.colors.cmap_register["classic"]
    ),
    cmap_func: fs.numpy_utils.Numpy_expr = (
            fs.numpy_utils.Numpy_expr("x", "np.log(x)")
    ),
    zmin: float = 0.0,
    zmax: float = 5.0,
    zshift: float = -1.0,
    mask_color: fs.colors.Color=(0.1, 0.1, 0.1, 1.0),

    _7: fs.gui.collapsible_separator="Plotting parameters: Newton field",
    int_layer: typing.Literal[
        "attractivity", "order", "attr / order"
    ]="attractivity",
    colormap_int: fs.colors.Fractal_colormap = (
            fs.colors.cmap_register["classic"]
    ),
    cmap_func_int: fs.numpy_utils.Numpy_expr = (
            fs.numpy_utils.Numpy_expr("x", "x")
    ),
    zmin_int: float = 0.0,
    zmax_int: float = 1.0,

    _5: fs.gui.collapsible_separator = "Plotting parameters: shading",
    has_shading: bool = True,
    shading_kind : typing.Literal["potential", "Milnor"] = "potential",
    lighting: Blinn_lighting = (
            fs.colors.lighting_register["glossy"]
    ),
    lighting_int: Blinn_lighting = (
            fs.colors.lighting_register["glossy"]
    ),
    max_slope: float = 60.,

    _6: fs.gui.collapsible_separator = "Plotting parameters: field lines",
    has_fieldlines: bool = False,
    fieldlines_func: fs.numpy_utils.Numpy_expr = (
            fs.numpy_utils.Numpy_expr("x", "x")
    ),
    fieldlines_kind: typing.Literal["overlay", "twin"] = "overlay",
    fieldlines_zmin: float = -1.0,
    fieldlines_zmax: float = 1.0,
    backshift: int = 3,
    n_iter: int = 4,
    swirl: float = 0.,
    damping_ratio: float = 0.8,
    twin_intensity: float = 0.1,


    _8: fs.gui.collapsible_separator="High-quality rendering options",
    final_render: bool=False,
    supersampling: fs.core.supersampling_type = "None",
    jitter: bool = False,
    recovery_mode: bool = False,

    _9: fs.gui.collapsible_separator="Extra outputs",
    output_masks: bool = False,
    output_normals: bool = False,
    output_heightmaps: bool = False,
    hmap_mask: float = 0.,
    int_hmap_mask: float = 0.,

    _10: fs.gui.collapsible_separator="General settings",
    log_verbosity: typing.Literal[fs.log.verbosity_enum
                                  ] = "debug @ console + log",
    enable_multithreading: bool = True,
    inspect_calc: bool = False,
    no_newton: bool = False,
    postproc_dtype: typing.Literal["float32", "float64"] = "float32",
    batch_params={}
):

    fs.settings.log_directory = os.path.join(fractal.directory, "log")
    fs.set_log_handlers(verbosity=log_verbosity)
    fs.settings.enable_multithreading = enable_multithreading
    fs.settings.inspect_calc = inspect_calc
    fs.settings.no_newton = no_newton
    fs.settings.postproc_dtype = postproc_dtype


    zoom_kwargs = {
        "x": x,
        "y": y,
        "dx": dx,
        "nx": nx,
        "xy_ratio": xy_ratio,
        "theta_deg": theta_deg,
        "has_skew": has_skew,
        "skew_00": skew_00,
        "skew_01": skew_01,
        "skew_10": skew_10,
        "skew_11": skew_11,
        "projection": batch_params.get(
            "projection"# , fs.projection.Cartesian()
        )
    }
    if fractal.implements_deepzoom:
        zoom_kwargs["precision"] = dps
    fractal.zoom(**zoom_kwargs)


    calc_std_div_kw = {
        "calc_name": calc_name,
        "subset": None,
        "max_iter": max_iter,
        "M_divergence": M_divergence,
    }


    if fractal.implements_dzndc == "user":
        calc_std_div_kw["calc_dzndc"] = calc_dzndc

    if shading_kind == "Milnor":
        calc_std_div_kw["calc_d2zndc2"] = True

    if has_fieldlines:
        calc_orbit = (backshift > 0)
        calc_std_div_kw["calc_orbit"] = calc_orbit
        calc_std_div_kw["backshift"] = backshift

    if fractal.implements_interior_detection == "always":
        calc_std_div_kw["epsilon_stationnary"] = epsilon_stationnary
    elif fractal.implements_interior_detection == "user":
        calc_std_div_kw["interior_detect"] = interior_detect
        calc_std_div_kw["epsilon_stationnary"] = epsilon_stationnary

    fractal.calc_std_div(**calc_std_div_kw)


    # Run the calculation for the interior points - if wanted
    if compute_newton:
        interior = Fractal_array(
                fractal, calc_name, "stop_reason", func= "x != 1"
        )
        fractal.newton_calc(
            calc_name="interior",
            subset=interior,
            known_orders=None,
            max_order=max_order,
            max_newton=max_newton,
            eps_newton_cv=eps_newton_cv,
        )


    pp = Postproc_batch(fractal, calc_name)

    if base_layer == "continuous_iter":
        pp.add_postproc(base_layer, Continuous_iter_pp())
        if output_heightmaps:
            pp.add_postproc("base_hmap", Continuous_iter_pp())

    elif base_layer == "distance_estimation":
        pp.add_postproc("continuous_iter", Continuous_iter_pp())
        pp.add_postproc(base_layer, DEM_pp())
        if output_heightmaps:
            pp.add_postproc("base_hmap", DEM_pp())

    if has_fieldlines:
        pp.add_postproc(
            "fieldlines",
            Fieldlines_pp(n_iter, swirl, damping_ratio)
        )
    else:
        fieldlines_kind = "None"

    pp.add_postproc("interior", Raw_pp("stop_reason", func="x != 1"))

    if compute_newton:
        pp_int = Postproc_batch(fractal, "interior")
        if int_layer == "attractivity":
            pp_int.add_postproc(int_layer, Attr_pp())
            if output_heightmaps:
                pp_int.add_postproc("interior_hmap", Attr_pp())
        elif int_layer == "order":
            pp_int.add_postproc(int_layer, Raw_pp("order"))
            if output_heightmaps:
                pp_int.add_postproc("interior_hmap", Raw_pp("order"))
        elif int_layer == "attr / order":
            pp_int.add_postproc(int_layer, Attr_pp(scale_by_order=True))
            if output_heightmaps:
                pp_int.add_postproc(
                    "interior_hmap", Attr_pp(scale_by_order=True)
                )

        # Set of unknown points
        pp_int.add_postproc(
            "unknown", Raw_pp("stop_reason", func="x == 0")
        )
        pps = [pp, pp_int]
    else:
        pps = pp

    if has_shading:
        pp.add_postproc("DEM_map", DEM_normal_pp(kind=shading_kind))
        if compute_newton:
            pp_int.add_postproc("attr_map", Attr_normal_pp())

    plotter = fs.Fractal_plotter(
        pps,
        final_render=final_render,
        supersampling=supersampling,
        jitter=jitter,
        recovery_mode=recovery_mode
    )

    # The mask values & curves for heighmaps
    r1 =  min(hmap_mask, 0.)
    r2 =  max(hmap_mask, 1.)
    dr = r2 - r1
    hmap_curve = lambda x : (np.clip(x, 0., 1.) - r1) / dr

    r1 =  min(int_hmap_mask, 0.)
    r2 =  max(int_hmap_mask, 1.)
    dr = r2 - r1
    int_hmap_curve = lambda x : (np.clip(x, 0., 1.) - r1) / dr


    # The layers
    plotter.add_layer(Bool_layer("interior", output=output_masks))

    if compute_newton:
        plotter.add_layer(Bool_layer("unknown", output=output_masks))

    if fieldlines_kind == "twin":
        plotter.add_layer(Virtual_layer(
                "fieldlines", func=fieldlines_func, output=False
        ))
    elif fieldlines_kind == "overlay":
        plotter.add_layer(Grey_layer(
                "fieldlines", func=fieldlines_func,
                probes_z=[fieldlines_zmin, fieldlines_zmax],
                output=False
        ))

    if has_shading:
        plotter.add_layer(Normal_map_layer(
            "DEM_map", max_slope=max_slope, output=output_normals
        ))
        plotter["DEM_map"].set_mask(plotter["interior"])
        if compute_newton:
            plotter.add_layer(Normal_map_layer(
                "attr_map", max_slope=90, output=output_normals
            ))

    if base_layer != 'continuous_iter':
        plotter.add_layer(
            Virtual_layer("continuous_iter", func=None, output=False)
        )

    plotter.add_layer(Color_layer(
            base_layer,
            func=cmap_func,
            colormap=colormap,
            probes_z=[zmin + zshift, zmax + zshift],
            output=True)
    )
    if output_heightmaps:
        plotter.add_layer(Disp_layer(
                "base_hmap",
                func=cmap_func,
                curve=hmap_curve,
                probes_z=[zmin + zshift, zmax + zshift],
                output=True
        ))


    if compute_newton:
        plotter.add_layer(Color_layer(
            int_layer,
            func=cmap_func_int,
            colormap=colormap_int,
            probes_z=[zmin_int, zmax_int],
            output=False))
        plotter[int_layer].set_mask(plotter["unknown"],
                                    mask_color=mask_color)
        if output_heightmaps:
            plotter.add_layer(Disp_layer(
                    "interior_hmap",
                    func=cmap_func,
                    curve=int_hmap_curve,
                    probes_z=[zmin_int, zmax_int],
                    output=True
            ))
            plotter["interior_hmap"].set_mask(
                plotter["unknown"],
                mask_color=(int_hmap_mask,)
            )

    if fieldlines_kind == "twin":
        plotter[base_layer].set_twin_field(
                plotter["fieldlines"], twin_intensity
        )
    elif fieldlines_kind == "overlay":
        overlay_mode = Overlay_mode("tint_or_shade", pegtop=1.0)
        plotter[base_layer].overlay(plotter["fieldlines"], overlay_mode)

    if has_shading:
        plotter[base_layer].shade(plotter["DEM_map"], lighting)
        if compute_newton:
            plotter[int_layer].shade(plotter["attr_map"], lighting_int)
            plotter["attr_map"].set_mask(plotter["unknown"],
                                         mask_color=(0., 0., 0., 0.))

    if compute_newton:
        # Overlay : alpha composite with "interior" layer ie, where it is not
        # masked, we take the value of the "attr" layer
        overlay_mode = Overlay_mode(
                "alpha_composite",
                alpha_mask=plotter["interior"],
                inverse_mask=True
        )
        plotter[base_layer].overlay(plotter[int_layer], overlay_mode=overlay_mode)
    else:
        plotter[base_layer].set_mask(
            plotter["interior"], mask_color=mask_color
        )

    if output_heightmaps:
        plotter["base_hmap"].set_mask(
            plotter["interior"], mask_color=(hmap_mask,)
        )

    plotter.plot()


if __name__ == "__main__":
    # Some magic to get the directory for plotting: with a name that matches
    # the file or a temporary dir if we are building the documentation
    func_map = {
        "Seahorse": setargs_Seahorse,
        "Elephant": setargs_Elephant
    }

    try:
        realpath = os.path.realpath(__file__)
        plot_dir = os.path.splitext(realpath)[0]
        plot_kwargs["fractal"] = fs.models.mandelbrot_M2.Mandelbrot(
            directory=plot_dir,
        )
        for v in valleys:
            plot_kwargs, batch_params = func_map[v](plot_kwargs)
            plot(**plot_kwargs, batch_params=batch_params)
            os.rename(
                os.path.join(plot_dir, "Color_layer_continuous_iter.png"),
                os.path.join(plot_dir, f"{v}_valley.png")
            )

    except NameError:
        import tempfile
        with tempfile.TemporaryDirectory() as plot_dir:
            plot_kwargs["fractal"] = fs.models.mandelbrot_M2.Mandelbrot(
                directory=plot_dir
            )
            for v in valleys:
                plot_kwargs, batch_params = func_map[v](plot_kwargs)
                fs.utils.exec_no_output(
                        plot, **plot_kwargs, batch_params=batch_params
                )
Total running time of the script: ( 1 minutes 1.244 seconds)